Maps and Data
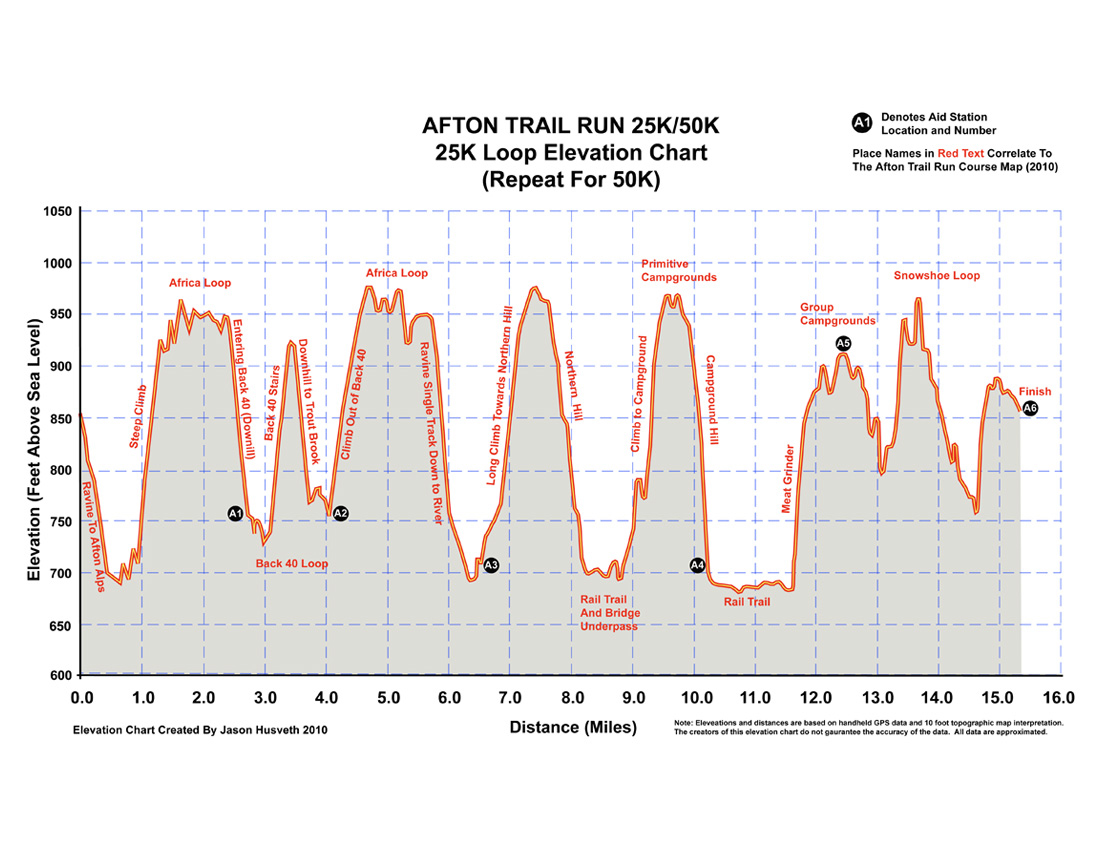
Race course maps, elevation profile and aid station distances can be found below. Following that are parking, check-in, start, finish diagrams.
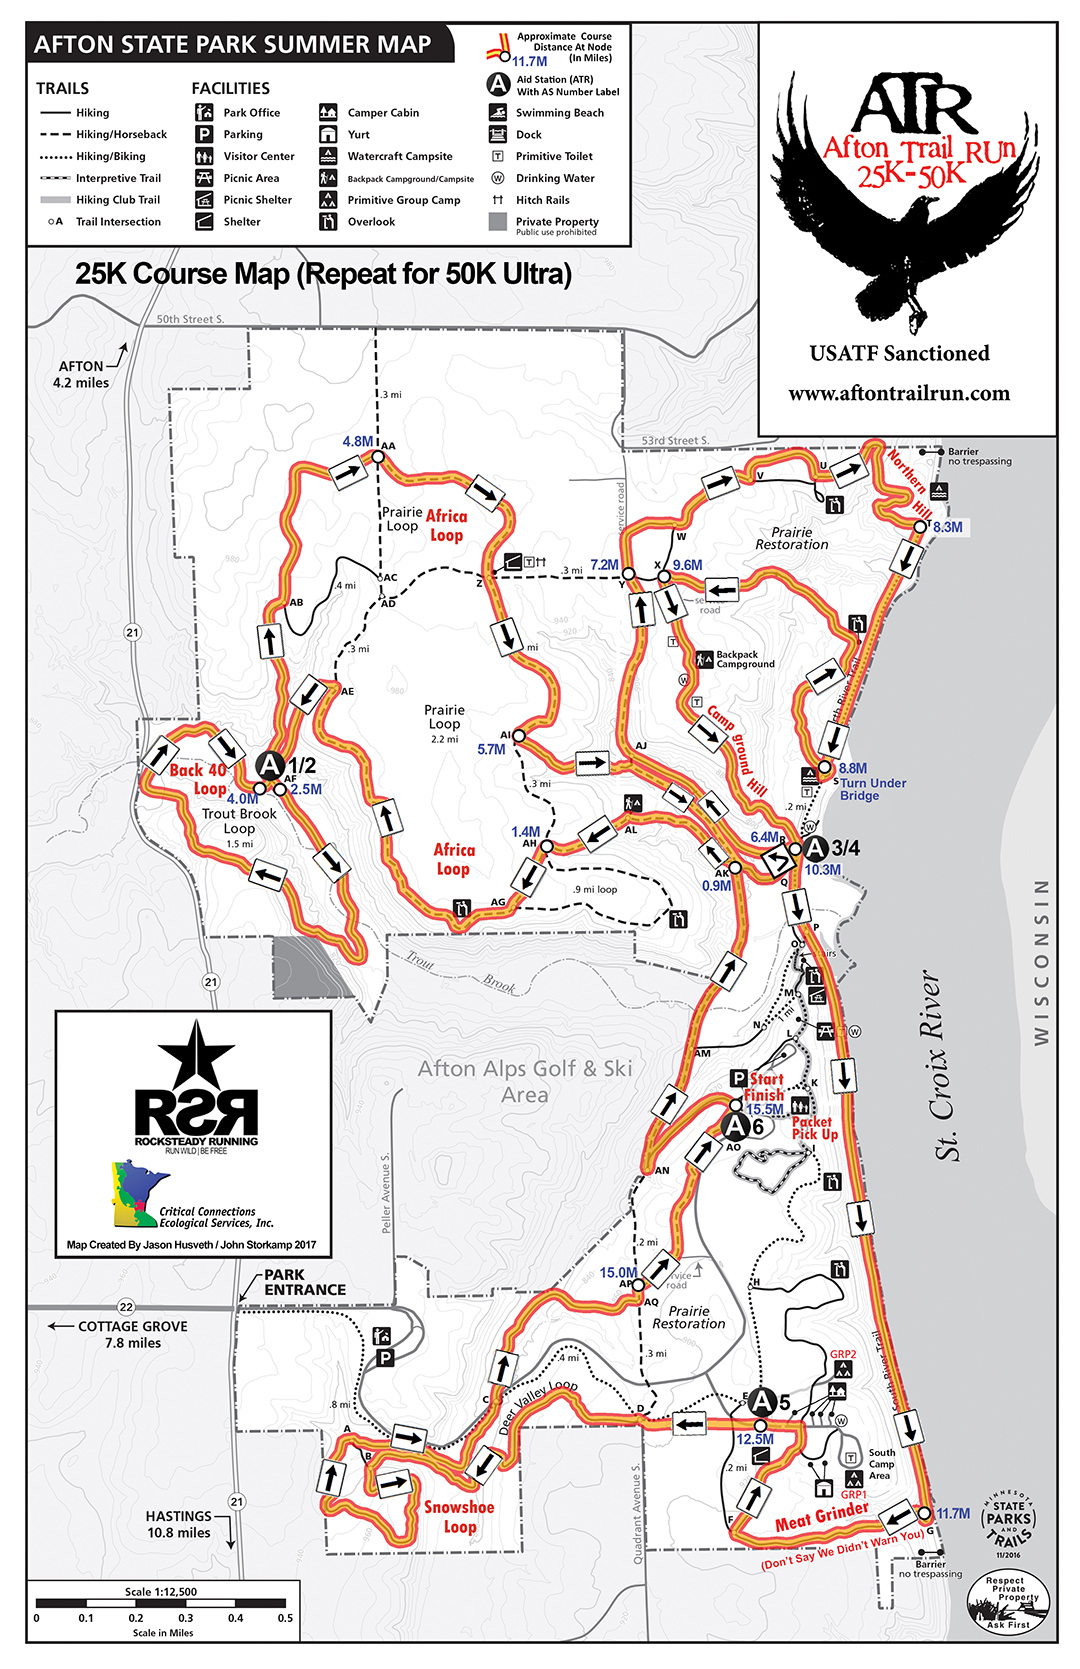
50KM:
2 x 15.5 mile loops = 31 miles
Elevation Gain 4,670 FT
Elevation Loss 4,670 FT
NET Elevation Change 9,340 FT
11 Aid Stations
25KM:
1 x 15.5 mile loop = 15.5 miles
Elevation Gain 2,335 FT
Elevation Loss 2,335 FT
NET Elevation Change 4,670 FT
5 Aid Stations